32817 Zip Code Monthly Housing Market Report
December 2023
Market Trends
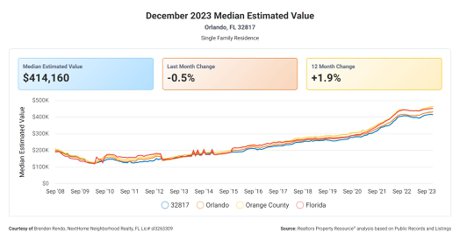
Median Estimated Value
Months of Inventory
Ladies and Gentlemen, Welcome to Our Real Estate Discussion Today
Where we will dive into some fascinating metrics that will surely pique the interest of both buyers and sellers. So, grab your coffee, take a seat, and let's unravel the correlation between these real estate metrics!
Months Supply of Inventory
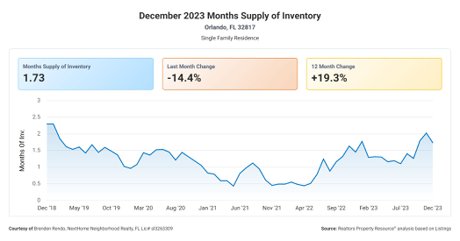
First up, we have the "Months Supply of Inventory," which currently stands at a healthy 1.73. Now, what does this mean for you as a buyer or seller?...
12-Month Change in Months of Inventory
However, let's take a closer look at the "12-Month Change in Months of Inventory," which shows a significant increase of 19.31%. This tells us that in the past year...
Median Days Homes are On the Market
Now, let's shift our focus to the "Median Days Homes are On the Market," which currently stands at a mere 27 days. This metric captures the average time it...
List to Sold Price Percentage
Moving on to the "List to Sold Price Percentage," we see a solid figure of 97.1%. This metric reflects the percentage of the listing price that homes are ultimately selling for...
Median Sold Price
Lastly, we come to the "Median Sold Price," which currently sits at a handsome $392,500. This metric represents the midpoint of all the homes sold in the market...
Conclusion
In conclusion, these real estate metrics paint an interesting picture for both buyers and sellers. We have a seller's market with low inventory and high list to sold price percentages...
Remember, the real estate market is ever-evolving, so staying informed and seeking expert advice will always be your best strategy. Good luck to all the buyers and sellers out there, and may your real estate dreams come true!