Area Real Estate News & Market Trends

You’ll find our blog to be a wealth of information, covering everything from local market statistics and home values to community happenings. That’s because we care about the community and want to help you find your place in it. Please reach out if you have any questions at all. We’d love to talk with you!

Feb. 10, 2024

Casselberry, FL Housing Market Trends Analysis For January - 32707 Zip Code Insights

Casselberry, FL Housing Market Trends Analysis for January - 32707 Zip Code Insights


Casselberry monthly housing trends


Casselberry Median Housing Value


Casselberry housing supply


Engaging Real Estate Metrics Overview

Welcome and Introduction to Real Estate Metrics

Good morning, ladies and gentlemen. Today, we're going to dive into some exciting real estate metrics that will surely keep both buyers and sellers engaged and interested. So, grab your morning coffee, sit back, and let's explore the correlation between these fascinating numbers.

Months Supply of Inventory Insights

First up, we have the "Months Supply of Inventory," which currently stands at 2.14. This metric indicates how long it would take to sell all the available homes on the market, assuming no new properties are listed. With a relatively low value of 2.14, it suggests that the real estate market is quite competitive, with limited inventory available for eager buyers.

Annual Change in Inventory Dynamics

Now, let's move on to the "12-Month Change in Months of Inventory," which has experienced a remarkable increase of +12.04%. This percentage represents the change in the number of months it would take to sell all the current inventory compared to the same period last year. A positive change like this indicates that inventory levels have increased, giving buyers a wider selection of homes to choose from.

Median Days on Market Analysis

Next, we have the "Median Days Homes are On the Market," which is a mere 19 days. This metric tells us how long, on average, it takes for a home to be sold after it's listed. With such a short duration, it's clear that the market is moving quickly, and homes are being snatched up at a rapid pace. Buyers need to be proactive and act fast, while sellers can feel confident that their properties won't linger on the market for long.

List to Sold Price Percentage Overview

Now, let's talk about the "List to Sold Price Percentage," which currently stands at an impressive 98.2%. This metric measures the ratio between the original listing price and the final selling price of a home. A high percentage like this suggests that sellers are achieving close to their asking prices, indicating a healthy and competitive market. Buyers should be aware that they may need to come prepared with strong offers to secure their dream home.

Median Sold Price Insights

Last but certainly not least, we have the "Median Sold Price," which is currently at a respectable $349,500. This metric represents the middle point of all the sold prices in a given area. It provides valuable insights into the overall market trend and can help both buyers and sellers gauge property values. With a median sold price like this, it's clear that the real estate market is strong and stable.

Conclusion: Navigating a Competitive Real Estate Market

In conclusion, these real estate metrics paint a picture of a competitive market with limited inventory but an increasing number of options for buyers. Homes are selling quickly, often at or near the asking price, indicating a healthy and robust market. Sellers can be confident in their ability to achieve a satisfactory sale, while buyers should be prepared to act swiftly and make strong offers. With a median sold price of $349,500, the market is showing stability and promising opportunities for both buyers and sellers.

Thank you for joining me on this exploration of real estate metrics. I hope you found it engaging and informative. Have a wonderful day!

Information provide by RPR of the National Realtor Association
Feb. 10, 2024

Deland, FL Housing Market Trends Analysis For January

Deland, FL Housing Market Trends Analysis For January

Deland monthly trends


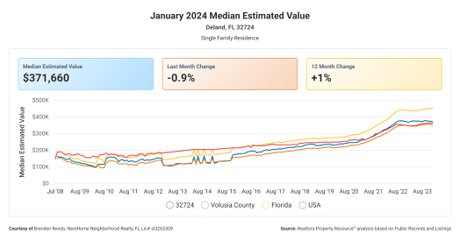
deland monthly estimated value


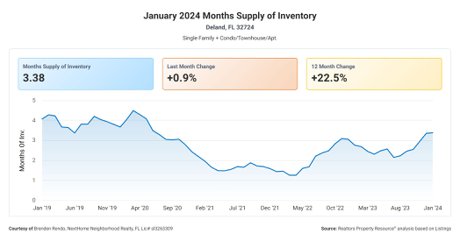
deland monthly inventory


Welcome to Our Real Estate Metrics Analysis

Introduction to Key Real Estate Metrics

Ladies and gentlemen, welcome to our real estate metrics analysis! Today, we are going to delve into the fascinating world of real estate and explore the correlation between several key metrics. Whether you're a buyer or a seller, this information is invaluable in understanding the current market trends and making informed decisions. So, let's jump right in!

Months Supply of Inventory

First up, we have the "Months Supply of Inventory," which stands at a healthy 3.34. This metric tells us the number of months it would take to sell all the currently available homes on the market if no new listings were added. A higher supply of inventory generally indicates a buyer's market, where there are more homes for sale than there are buyers. This can lead to increased negotiating power for buyers and potentially lower prices.

Annual Change in Months of Inventory

Next, we have the "12-Month Change in Months of Inventory," which has shown a significant increase of 19.71%. This indicates that the supply of homes on the market has been steadily increasing over the past year. For sellers, this means that competition may be tougher, and it might take a bit longer to sell their property. Buyers, on the other hand, may have more options to choose from and potentially more negotiating power.

Median Days Homes are On the Market

Moving on, we have the "Median Days Homes are On the Market," which currently stands at 35. This metric gives us an idea of how long it takes, on average, for a home to sell. A lower number suggests a more active market, where homes are selling relatively quickly. For sellers, this can be a positive sign, as it means their property has a good chance of being snatched up in a reasonable timeframe. Buyers, however, may need to act swiftly to secure their desired home.

List to Sold Price Percentage

Now, let's talk about the "List to Sold Price Percentage," which is an impressive 98.3%. This metric reveals the percentage of the original listing price that homes are typically sold for. A higher percentage indicates that sellers are able to sell their homes close to the asking price. For sellers, this can be seen as a positive indicator of a strong market and the potential for a profitable sale. For buyers, it suggests that they may need to be prepared to make competitive offers to secure their dream home.

Median Sold Price

Lastly, we have the "Median Sold Price," which currently stands at $388,995. This metric provides us with the midpoint value of all the homes that have been sold in the area. It gives both buyers and sellers a general idea of the price range they can expect in the market. For sellers, this is the potential value they can expect to receive for their property. For buyers, it helps them understand the average price they may need to budget for when searching for a home in this area.

Conclusion: Empowering Real Estate Decisions

In conclusion, these real estate metrics provide valuable insights for both buyers and sellers. By understanding the correlation between them, you can make informed decisions and navigate the market with confidence. Whether you're looking to buy or sell, these metrics empower you to seize the opportunities presented by the current market conditions. So, go forth and make the most of this knowledge to achieve your real estate goals!

Information provided by RPR of the National Realtor Association
Feb. 10, 2024

Deltona, FL Housing Market Trends Analysis for January - 32738 Zip Code Insights

Deltona, FL Housing Market Trends Analysis For January - 32738  Zip Code Insights

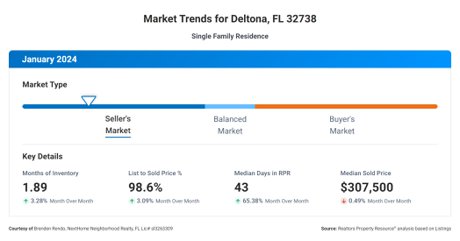
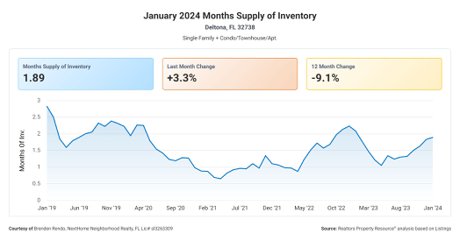
32738 January Market Report

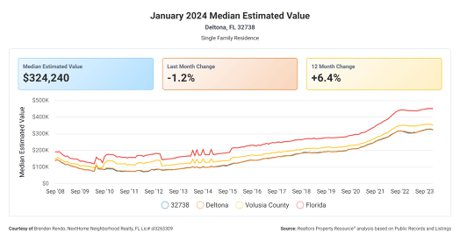
32738 January Median Home Value

32738 Months of Housing Inventory


Ladies and Gentlemen: Navigating the Real Estate Metrics

Introduction to Real Estate Metrics and Their Impact

Today we will delve into the fascinating world of real estate metrics, specifically focusing on the correlation between various factors that can greatly impact both buyers and sellers. So, whether you are looking to buy your dream home or sell your property for a fair price, this analysis will provide you with valuable insights to guide your decisions.

Months Supply of Inventory Analysis

Let's start by examining the "Months Supply of Inventory," which currently stands at 1.89. This metric represents the number of months it would take to sell all the available homes on the market if no new listings were added. A lower value typically indicates a seller's market, where demand exceeds supply, leading to higher prices and potentially quicker sales.

Year-Over-Year Change in Inventory

Now, let's consider the "12-Month Change in Months of Inventory," which has experienced a decline of -9.13%. This significant decrease suggests that the real estate market has become even more competitive in the past year. Buyers may face more difficulties finding the right property, as the supply has dwindled, while sellers may benefit from increased demand and potentially higher sale prices.

Median Days Homes are On the Market

Moving on, we come to the "Median Days Homes are On the Market," which currently stands at 43 days. This metric measures the average number of days it takes for a home to be sold. A lower value indicates a faster-paced market, where homes are being snatched up quickly. For sellers, this means that properly priced and well-presented properties have a higher chance of attracting buyers swiftly. On the other hand, buyers should be prepared to act decisively and promptly when they find a property that meets their criteria.

List to Sold Price Percentage

Next, we have the "List to Sold Price Percentage," which currently sits at an impressive 98.6%. This metric highlights the negotiation power of sellers, as it represents the percentage of the listing price that homes are typically sold for. A higher percentage suggests that sellers are obtaining prices close to their asking price, indicating a strong market. However, buyers should not be discouraged, as there may still be opportunities to negotiate a fair deal within this competitive environment.

Understanding the Median Sold Price

Finally, we arrive at the "Median Sold Price," which currently stands at $307,500. This metric represents the midpoint of all the sold prices in a given area. It is a crucial figure for both buyers and sellers, as it provides a general indication of the market's price range. Buyers can use this information to assess whether a property falls within their budget, while sellers can determine a suitable listing price based on the current market conditions.

Conclusion: Making Informed Decisions in a Competitive Market

In conclusion, the correlation between these real estate metrics paints a picture of a highly competitive market, with limited supply and strong demand. Sellers may benefit from faster sales, higher sale prices, and a good chance of securing prices close to their listing price. As for buyers, they must act quickly, be prepared to negotiate, and ensure that their budget aligns with the median sold price.

By understanding these metrics and their correlation, both buyers and sellers can make informed decisions that will lead to successful transactions in the dynamic world of real estate.

*Information provide by RPR reports for the National Association of Realtors
Feb. 8, 2024

Jerome Powell's Warning: The Commercial Real Estate Crisis Ahead

JEROME POWELL'S WARNING

THE COMMERCIAL REAL ESTATE CRISIS AHEAD


Intriguing Insights from Jerome Powell

In today's vibrant discussion, we cast our lens wide, embracing an array of developments that have stirred the waters in recent times. At the heart of our dialogue, Jerome Powell emerges as a figure of intrigue, his narrative on "60 Minutes" a tapestry of the expected, woven with threads of nuanced concern particularly about commercial real estate—a realm teetering on the subtle edge of disquiet.

The Subtle Tumult of Commercial Real Estate

Powell's delivery, marked by an understated monotone, cleverly encases warnings of potential tumult within the commercial real estate sector. This, despite its subdued presentation, casts a shadow over certain banking entities, hinting at closures that loom on the horizon, albeit in a manner deemed manageable by some. Herein lies a fascinating dichotomy: a predicament portrayed as both contained and precariously balanced.

A Curious Departure and Strategic Moves

Our journey takes an intriguing detour as we delve into the curious episode of a risk chief's abrupt exit from New York Community Bank. This departure, occurring just before the revelation of fourth-quarter losses, raises eyebrows, suggesting a storm brewing in the not-too-distant future.

The narrative unfurls, touching upon the strategic moves of various banks amidst these choppy waters. The acquisition of Signature Bank's assets by New York Community Bank, for instance, raises questions of foresight or hidden strategies amidst financial turbulence.

Broad Implications for the Banking Sector

As the conversation unfolds, we explore the broader implications for the banking sector, especially for smaller institutions caught in the web of commercial real estate challenges. A notable portion of local banks finds themselves deeply entrenched in commercial assets, positioning them precariously as economic dominoes begin to fall.

Regulatory Oversight and Global Ramifications

Regulatory figures step into the spotlight, with Treasury Secretary Janet Yellen calling upon banks to prepare for the storm ahead. This guidance, coupled with the need for banks to strengthen their reserves, paints a picture of cautious anticipation in the face of looming economic challenges.

Expanding our gaze, we consider the global ramifications of the U.S. commercial real estate sector's instability. This interconnection underscores the shared apprehensions and cautious optimism that permeate the global banking community as it navigates these uncertain waters.

Conclusion: A Market at a Pivotal Juncture

As we draw our discussion to a close, we examine the pulse of the real estate industry, revealing shifts in market dynamics, the contraction of wholesaler operations, and a concerning uptick in condo foreclosures. These elements, woven together, depict a market at a pivotal juncture, facing uncertainty and the necessity for adaptation.

In wrapping up, we reflect on the rich tapestry of insights and observations shared today. We express our gratitude for your engagement and invite you to accompany us on future voyages through the economic landscape. Until then, we bid you farewell, eager to explore and unravel the complexities of commerce and finance anew.

Feb. 1, 2024

Federal Reserve Decisions, Bank Failures, and the Evergrande Crisis – Implications for the Housing Market

Navigating the Waters: Federal Reserve Decisions, Bank Failures, and the Evergrande Crisis – Implications for the Housing Market

The Federal Reserve's Stance on Rate Cuts

The Federal Reserve's recent meeting brought forward some critical insights, notably around interest rates. Despite speculation and social media buzz predicting multiple rate cuts, the Fed's cautious stance suggests otherwise. Powell's remarks highlight a strategy of patience, pointing towards a future where decisions are measured and reflective of evolving economic indicators. This cautious approach, especially in light of inflation concerns and economic stability, signals a departure from rapid rate adjustments.

Bank Failures: A Canary in the Coal Mine?

The banking sector's health is always a reflection of broader economic trends. Recent alerts around potential bank failures, notably within institutions heavily invested in commercial real estate and rent-controlled housing mortgages, underscore the fragility of certain market segments. The case of New York Community Bank Corp, facing significant losses and downgrades, illustrates the precarious balance banks navigate between lending practices and economic realities. These developments serve as a stark reminder of the 2008 crisis, though the current landscape is shaped by different variables.

Evergrande's Ripple Effect

Across the globe, China's real estate giant Evergrande faces liquidation, signaling a crisis of confidence in international markets. With substantial assets at stake, the fallout could have far-reaching effects, particularly on foreign investors, including U.S. pension funds. This situation exemplifies the interconnectedness of global finance, where a collapse in one region can reverberate across continents, affecting investor confidence and market stability.

The Housing Market at a Crossroads

Amid these developments, the housing market finds itself at a crossroads. The Fed's reluctance to lower rates in response to economic pressures hints at a complex balancing act. Housing prices, influenced by interest rates and market demand, haven't cooled as expected, leading to a recalibration of strategies among buyers and sellers. The market's response to these dynamics, from rate negotiations to inventory adjustments, will be telling of the sector's resilience and adaptability.

The Road Ahead

As we navigate these uncertain times, the interplay between monetary policy, banking stability, and real estate dynamics demands close observation. The challenges posed by potential bank failures, the Evergrande crisis, and the Fed's strategic decisions on rate cuts underscore a period of adjustment and vigilance. For investors, homeowners, and market watchers, the coming months will be critical in shaping perspectives and strategies in an ever-evolving economic landscape.

Conclusion

In conclusion, while the immediate future holds uncertainty, the lessons from these developments are clear. Economic resilience depends on a delicate balance between policy, market confidence, and real-world outcomes. As we watch these stories unfold, their impact on the housing market and broader financial stability will undoubtedly provide crucial insights into navigating future economic challenges.

Jan. 27, 2024

Ultimate Guide to Buying a Retirement Home: Key Features for Seniors Seeking Comfort and Accessibility

Ultimate Guide to Buying a Retirement Home

Key Features for Seniors Seeking Comfort  and Accessibility

Ultimate Guide to Buying a Retirement Home


Guide to Finding Your Golden Years Home

As you prepare to find a new home for your golden years, it's crucial to consider various aspects that will ensure comfort, safety, and ease in your day-to-day life. This guide, shared by The Homes In Orlando Team, is tailored specifically for you, focusing on key features that support aging in place gracefully and happily.

The Single-Story Advantage

Selecting a single-story home is a strategic move to sidestep the difficulties posed by stairs in later years. This choice streamlines everyday life, ensuring each room is easily reachable, thereby minimizing the hazard of falls. Additionally, a single-story home often requires less maintenance, easing the physical and financial burdens. Its layout is not just convenient for your present lifestyle but is also foresighted, accommodating potential mobility changes in the future.

Seamless Accessibility

Imagine stepping into a home where every corner is accessible, regardless of mobility changes. Homes with pre-installed wheelchair ramps or those that can easily accommodate such modifications are invaluable. Not only does this feature provide peace of mind, but it also fosters independence in your living space. When touring potential homes, visualize your future ease of movement in every area.

Prioritize Bathroom Safety

Bathrooms, while often overlooked, are fundamental in ensuring your safety and comfort as you age. It's important to find homes where the bathrooms are not only functional but also thoughtfully designed to accommodate your future needs. Look for features like sturdy grab bars, non-slip flooring, and layouts that are compatible with mobility aids. Additionally, consider the ease of access to the shower or bath, as step-in showers can greatly enhance safety.

Age-In-Place Innovations

The market is full of products designed to make aging in place smoother and more comfortable. From simple gadgets to advanced technology, these tools can transform your living experience. It's essential to delve into product reviews and choose items that genuinely meet your needs and enhance your daily life.

The Value of Home Protection

For aging homebuyers, obtaining a home warranty is a wise strategy to protect against costly repairs. Homeowners insurance is vital for addressing damages to the home's structure, theft, and injuries occurring on the property, but it does not cover the failure of appliances or systems. This is where a home warranty becomes valuable, providing an annual renewable agreement that covers the repair of key systems such as heating, cooling, electrical, and plumbing, as well as appliance breakdowns. This coverage can significantly alleviate financial burdens. A home warranty offers not just financial security but also comfort and reassurance in later life.

Low Maintenance, High Enjoyment

Selecting a home with a low-maintenance exterior, such as durable siding, minimal landscaping, and composite decking, smartly reduces the need for frequent upkeep. A home designed with materials that withstand the elements and require minimal care not only saves time but also minimizes unexpected repair expenses. This focus on low-maintenance living allows you to spend your retirement years in comfort and ease, engaging in activities you love rather than constant home maintenance.

Look to Future Care

In choosing where to settle for retirement, the presence and caliber of local senior care facilities should be a key factor. With advancing age, healthcare requirements can evolve, possibly leading to the need for round-the-clock medical support, and a transition to a nursing home. It's beneficial to online platforms to investigate communities in your area, examining their reports, cost details, available payment options, and feedback from other families. Such proactive research guarantees access to trustworthy care if the situation arises.

In your search for a home to spend your golden years, prioritizing these features will ensure that your new residence is not just a house, but a haven of comfort, safety, and happiness. Each element, from seamless accessibility to strategic locations and innovative age-in-place products, plays a crucial role in enriching your life. Remember, this is more than a move; it's a step towards a fulfilling, worry-free future. Embrace this journey with confidence, knowing that your perfect home is waiting for you.

Find Your Dream Property in Orlando

Are you looking to buy in the Orlando area? Turn to The Homes In Orlando Team to find your dream property today!

Posted in Topic Of Interest
Jan. 25, 2024

Real Estate Market Analysis: GDP Impact, Fed Decisions & Home Sales Trends


Latest Real Estate Insights: GDP Growth, Fed Cuts, and Housing Market Trends 

Introduction:

Welcome to our latest discussion on the dynamic real estate market. I'm Brenden Rendo from the Homes in Orlando team, joined by Joseph Dionne of Appli Home Loans. Today, we delve into the latest economic indicators and their impact on the real estate sector, including GDP growth, Federal Reserve actions, and home builder earnings.

GDP and Market Reactions:

We start with the surprising GDP growth, reported at a robust 3.3% for the fourth quarter, surpassing expectations of 2%. This significant growth, coupled with holiday spending patterns, indicates a strong economic environment. However, flat manufacturing numbers and concerns about the Fed's rate decisions create a complex scenario for investors and homebuyers.

Real Estate Market Analysis:

The real estate market is experiencing a whirlwind of activities. Home builders are missing earnings, leading to substantial write-offs. We're seeing an increase in new home sales, fueled by lower interest rates. Yet, questions arise about the sustainability of these trends and the potential for rate cuts by the Federal Reserve.

Lending and Mortgage Trends:

Joseph Dionne provides insights into the current state of home loans. With fluctuating interest rates, we discuss strategies for buyers to secure favorable mortgage terms. We also cover the impact of the Fed's policies on lending and the potential for future rate cuts.

Home Builders' Challenges and Opportunities:

We take a closer look at home builders like Dow Chemicals and Dr. Horton. Despite economic growth, these companies face challenges due to declining manufacturing in China and other market pressures. We discuss how these factors influence home prices and buyer incentives.

Market Opportunities for Buyers:

Despite some economic uncertainties, now may be an opportune time for homebuyers. With incentives from builders and potential rate cuts, buyers have unique opportunities to negotiate favorable deals. We examine current sales trends, inventory levels, and pricing strategies in the housing market.

Conclusion:

Thank you for joining us for this comprehensive analysis of the real estate market. Stay tuned for more updates on housing trends, mortgage rates, and economic indicators impacting your real estate decisions.

Jan. 25, 2024

Understanding Attorney Opinion Letters: A New Era in Real Estate Transactions


Understanding Attorney Opinion Letters: A New Era in Real Estate Transactions

Introduction

The world of real estate is ever-evolving, and a significant update in mortgage lending could change the game for many involved in the home buying and selling process. Fannie Mae's recent revisions to its Selling Guide introduce the Attorney Opinion Letter (AOL) as an alternative to traditional title insurance. This blog post delves into what these changes mean for closing costs, risk management, and equitable homeownership.

What is an Attorney Opinion Letter (AOL)?

An AOL is a legal document provided by an attorney, offering an opinion on the state of a property's title. This alternative to traditional title insurance is now gaining traction, thanks to recent changes in lending guidelines by Fannie Mae.

Cost Benefits of AOLs

One of the primary advantages of AOLs is the potential reduction in closing costs. Title insurance premiums can be a significant expense in real estate transactions, and AOLs may offer a more cost-effective solution. We'll explore how this can benefit both buyers and sellers in the market.

Risk Protection: AOLs vs. Title Insurance

While AOLs can be more affordable, it's crucial to understand their level of risk protection compared to traditional title insurance. This section will compare and contrast the two, providing insights into which option might be best suited for different types of real estate transactions.

Facilitating Equitable Homeownership

Fannie Mae's move to include AOLs is part of a broader effort to make homeownership more accessible and equitable. We'll discuss how this change can positively impact first-time homebuyers and those in lower-income brackets.

Implications for Lenders and Borrowers

The introduction of AOLs presents new considerations for both lenders and borrowers. Lenders need to adapt to these changes, while borrowers must understand how AOLs could affect their home buying or refinancing decisions.

Conclusion

The inclusion of Attorney Opinion Letters in Fannie Mae's Selling Guide marks a significant shift in the real estate industry. As we navigate these changes, it's essential for buyers, sellers, and those looking to refinance to stay informed. Stay tuned for more updates and insights into how these changes will shape the future of real estate transactions.

Information provided by Robert L Reich of Voxture Settlement Services
Posted in Topic Of Interest
Jan. 15, 2024

32730 Zip Code Monthly Housing Market Report

32730 Zip Code Monthly Housing Market Report

December 2023

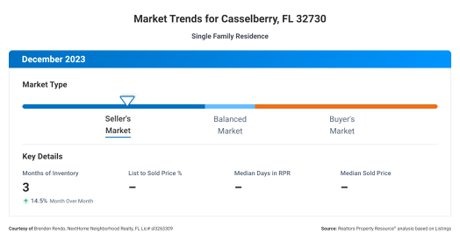
32730 Zip Code Market Trends

Market Trends

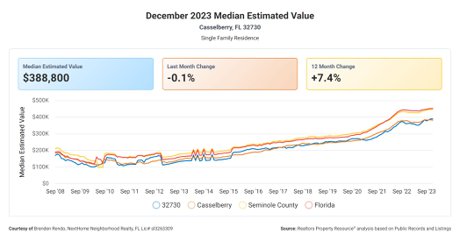
32730 Zip Code Median Estimated Value

Median Estimated Value

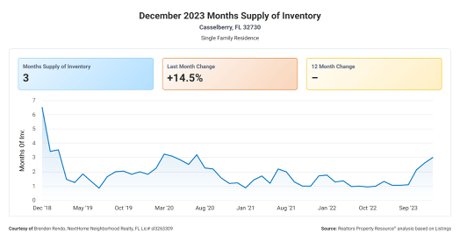
32730 Zip Code Months of Inventory

Months Of Inventory


Ladies and Gentlemen, Welcome to Our Real Estate Discussion Today

Where we will dive into some fascinating metrics that will surely pique the interest of both buyers and sellers. So, grab your coffee, take a seat, and let's unravel the correlation between these real estate metrics!

Months Supply of Inventory

First up, we have the "Months Supply of Inventory," which currently stands at a healthy 1.73. Now, what does this mean for you as a buyer or seller?...

12-Month Change in Months of Inventory

However, let's take a closer look at the "12-Month Change in Months of Inventory," which shows a significant increase of 19.31%. This tells us that in the past year...

Median Days Homes are On the Market

Now, let's shift our focus to the "Median Days Homes are On the Market," which currently stands at a mere 27 days. This metric captures the average time it...

List to Sold Price Percentage

Moving on to the "List to Sold Price Percentage," we see a solid figure of 97.1%. This metric reflects the percentage of the listing price that homes are ultimately selling for...

Median Sold Price

Lastly, we come to the "Median Sold Price," which currently sits at a handsome $392,500. This metric represents the midpoint of all the homes sold in the market...

Conclusion

In conclusion, these real estate metrics paint an interesting picture for both buyers and sellers. We have a seller's market with low inventory and high list to sold price percentages...

Remember, the real estate market is ever-evolving, so staying informed and seeking expert advice will always be your best strategy. Good luck to all the buyers and sellers out there, and may your real estate dreams come true!

Jan. 15, 2024

32817 Zip Code Monthly Housing Market Report

32817 Zip Code Monthly Housing Market Report

December 2023

32817 Zip Code Market Trends

Market Trends

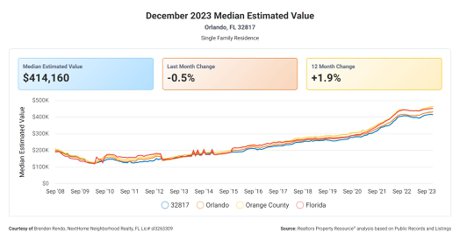
32817 Zip Code Median Estimated Property Value

Median Estimated Value

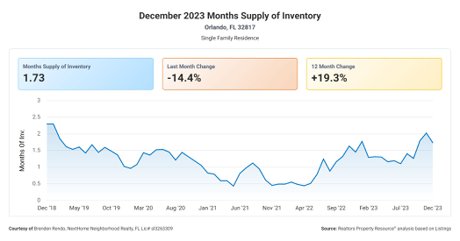
32817 Months Supply of Inventory


Months of Inventory


Ladies and Gentlemen, Welcome to Our Real Estate Discussion Today

Where we will dive into some fascinating metrics that will surely pique the interest of both buyers and sellers. So, grab your coffee, take a seat, and let's unravel the correlation between these real estate metrics!

Months Supply of Inventory

First up, we have the "Months Supply of Inventory," which currently stands at a healthy 1.73. Now, what does this mean for you as a buyer or seller?...

12-Month Change in Months of Inventory

However, let's take a closer look at the "12-Month Change in Months of Inventory," which shows a significant increase of 19.31%. This tells us that in the past year...

Median Days Homes are On the Market

Now, let's shift our focus to the "Median Days Homes are On the Market," which currently stands at a mere 27 days. This metric captures the average time it...

List to Sold Price Percentage

Moving on to the "List to Sold Price Percentage," we see a solid figure of 97.1%. This metric reflects the percentage of the listing price that homes are ultimately selling for...

Median Sold Price

Lastly, we come to the "Median Sold Price," which currently sits at a handsome $392,500. This metric represents the midpoint of all the homes sold in the market...

Conclusion

In conclusion, these real estate metrics paint an interesting picture for both buyers and sellers. We have a seller's market with low inventory and high list to sold price percentages...

Remember, the real estate market is ever-evolving, so staying informed and seeking expert advice will always be your best strategy. Good luck to all the buyers and sellers out there, and may your real estate dreams come true!