


By Brenden Rendo, Realtor · Updated October 8, 2026
In September, 1,038 Central Florida sellers took the sign out of the yard without a sale. Some listings expired. More were canceled early. It is easy to blame the market. But 2,975 homes did sell in the same four counties in September, in that same market. I pulled every residential listing in Orange, Seminole, Lake, and Volusia that expired or was canceled in September 2026 and was not put back on the market by September 30, and lined it up against every home that closed. About 1 in 4 of the listings that left the market in September left without a sale.
- 1,038 listings expired or were canceled in September 2026 and were not relisted that month (393 expired, 645 canceled), against 2,975 closed sales. That is 25.87% of the listings that left the market, about 1 in 4.
- A year earlier, in September 2025, the share was 30.54%. September 2026 is down 4.68 percentage points, and the 7th lowest of the last 13 months.
- Seminole had the lowest unsold share at 19.67%; Volusia the highest at 27.71%.
- Condos, townhomes and villas failed at 51.5 per 100 sales, against 30 for houses. By price, $1,000,000 and up was worst at 56.3 per 100.
- 35.55% of the unsold listings never cut their price. Homes that sold closed at a median 95.95% of their original asking price.
1. September County by County
Here is September by county. "Unsold" means the listing expired or was canceled during the month and the property was not relisted for sale by September 30.
| County | Expired | Canceled | Unsold total | Sold | Share that left unsold | Unsold per 100 sales |
|---|---|---|---|---|---|---|
| Orange | 156 | 311 | 467 | 1,265 | 26.96% | 36.9 |
| Seminole | 37 | 69 | 106 | 433 | 19.67% | 24.5 |
| Lake | 89 | 143 | 232 | 669 | 25.75% | 34.7 |
| Volusia | 111 | 122 | 233 | 608 | 27.71% | 38.3 |
| 4-county total | 393 | 645 | 1,038 | 2,975 | 25.87% | 34.9 |
Source: Stellar MLS residential listings, Orange, Seminole, Lake, and Volusia counties, September 2026, pulled October 6, 2026. Sold = closings recorded with a September close date as of that day.
Seminole is the best place to be a seller right now by this measure. 19.67% of its departing listings left unsold, 24.5 for every 100 sales. Volusia is the hardest, at 27.71% and 38.3 per 100.
Canceled listings outnumber expired ones 645 to 393. Most sellers who leave unsold do not wait for the agreement to run out.
2. Is 1 in 4 High? The Last 13 Months
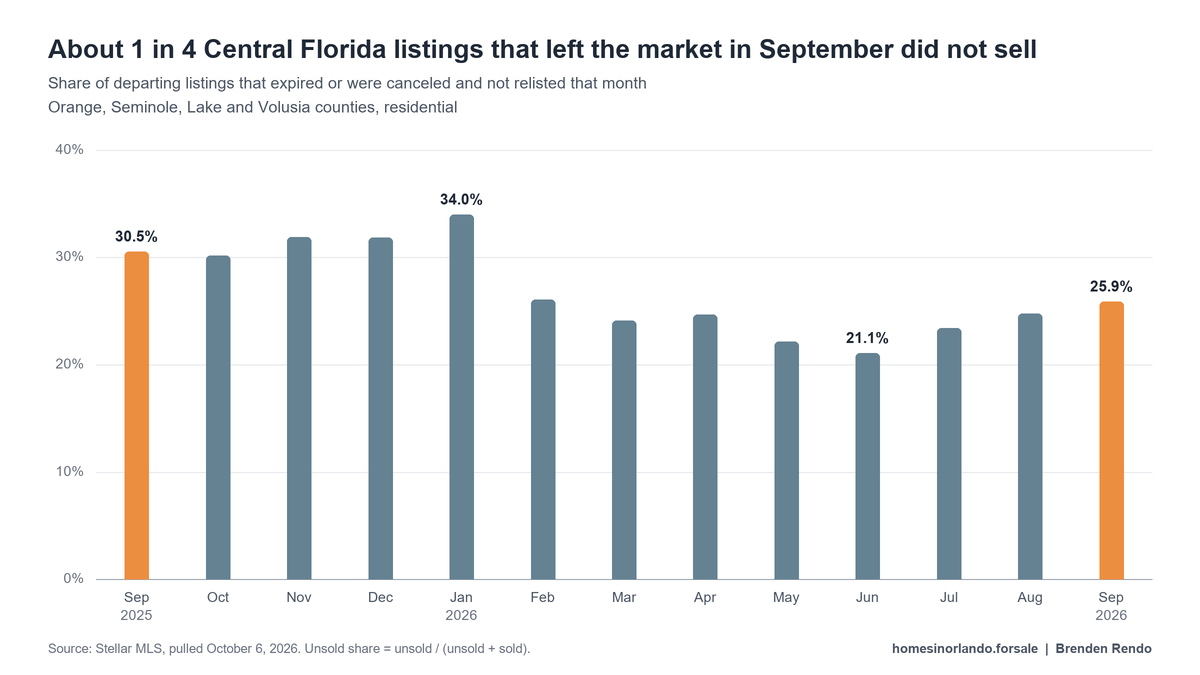
One month is not a market, so here are the same numbers, counted the same way, for every month back to September 2025.
| Month | Expired | Canceled | Unsold total | Sold | Share that left unsold |
|---|---|---|---|---|---|
| September 2025 | 491 | 896 | 1,387 | 3,154 | 30.54% |
| October 2025 | 503 | 840 | 1,343 | 3,107 | 30.18% |
| November 2025 | 404 | 823 | 1,227 | 2,619 | 31.90% |
| December 2025 | 673 | 800 | 1,473 | 3,150 | 31.86% |
| January 2026 | 388 | 761 | 1,149 | 2,232 | 33.98% |
| February 2026 | 349 | 589 | 938 | 2,664 | 26.04% |
| March 2026 | 358 | 707 | 1,065 | 3,354 | 24.10% |
| April 2026 | 384 | 708 | 1,092 | 3,334 | 24.67% |
| May 2026 | 346 | 662 | 1,008 | 3,547 | 22.13% |
| June 2026 | 325 | 674 | 999 | 3,737 | 21.09% |
| July 2026 | 361 | 714 | 1,075 | 3,515 | 23.42% |
| August 2026 | 357 | 704 | 1,061 | 3,225 | 24.76% |
| September 2026 | 393 | 645 | 1,038 | 2,975 | 25.87% |
Source: Stellar MLS, same four counties and the same definitions each month. Each month's relist check runs to the last day of that month.
September 2026's 25.87% is down 4.68 percentage points from September 2025's 30.54%. Over the 12 months before it, the share ran from 21.09% in June 2026 to 33.98% in January 2026, with a median of 25.40%. September 2026 is the 7th lowest of the 13, 0.47 percentage points above that median, and up 1.11 percentage points from August 2026's 24.76%. The year-over-year drop is real, and so is the rise since the June 2026 low. By county, year over year: Orange 30.15% to 26.96%, Seminole 26.45% to 19.67%, Lake 29.26% to 25.75%, Volusia 34.56% to 27.71%.
For a national yardstick, Realtor.com's September 2026 housing report puts delistings at about 5.6% of homes on the market nationally in September, in line with a year earlier. That is a different measure, a share of all active listings rather than of listings that left, so it does not line up with the table above number for number.
3. Where Listings Fail Most: Property Type and Price
Condos and houses are different decisions, so they are counted separately.
| Property type | Unsold | Sold | Share that left unsold | Unsold per 100 sales |
|---|---|---|---|---|
| Houses | 682 | 2,276 | 23.06% | 30 |
| Condos, townhomes and villas | 301 | 584 | 34.01% | 51.5 |
| Condo-hotels, manufactured and other | 55 | 115 | 32.35% | 47.8 |
| Original asking price | Unsold | Sold | Share that left unsold | Unsold per 100 sales |
|---|---|---|---|---|
| Under $300,000 | 308 | 704 | 30.43% | 43.8 |
| $300,000 to $499,999 | 353 | 1,278 | 21.64% | 27.6 |
| $500,000 to $749,999 | 200 | 599 | 25.03% | 33.4 |
| $750,000 to $999,999 | 74 | 211 | 25.96% | 35.1 |
| $1,000,000 and up | 103 | 183 | 36.01% | 56.3 |
Source: Stellar MLS, September 2026. Price bands use each listing's original asking price, so sold and unsold homes are grouped by where they started.
Condos, townhomes and villas fail most often. 51.5 left unsold for every 100 that sold, against 30 for houses. For condos, association dues, insurance, and building inspection requirements all add to a buyer's monthly cost, which narrows the pool of buyers who can say yes.
By price, the $300,000 to $499,999 band works best, at 27.6 unsold per 100 sales. $1,000,000 and up is the hardest, at 56.3 per 100.
4. What the Homes That Sold Did Differently
Here are the 1,038 unsold listings next to the 2,975 sales on the same measures.
| Left unsold (1,038) | Sold (2,975) | |
|---|---|---|
| Median original asking price | $400,000 | $409,990 |
| Median original asking price per sq ft | $235 | $234 |
| Reduced the price at least once | 64.45% | 75.33% closed below original |
| Median reduction, those that reduced | 5.38% | closed at 95.95% of original |
| Median days on the market | 146 (until it came off) | 41 (until under contract) |
Source: Stellar MLS, September 2026. Price per square foot excludes listings under 200 sq ft or without a size. Days for unsold listings run from going live to coming off; days for sold homes run from going live to going under contract.
The clearest difference is movement. 35.55% of the sellers who left unsold never reduced their price at all. The homes that sold mostly did give ground: 75.33% closed below their original asking price, at a median of 95.95% of it. They went under contract in a median 41 days. The unsold listings had sat a median 146.
What the data does not clearly show, and I checked: that the unsold homes started at much higher prices per square foot. Across all four counties, the median unsold house started 2.94% above the median sold house per square foot, and for condos the gap was 0.35% below. County by county it ranges from -9.94% for Lake condos to +10.98% for Volusia condos. That comparison mixes neighborhoods, so it is a blunt tool. The cleaner signal is the one above: the sellers who sold adjusted, and 35.55% of the ones who quit never did.
5. Expired, Canceled, and the Relist Rule
Two different endings, one result. An expired listing reached the end of its listing agreement unsold. A canceled listing ended early, which can mean the seller switched agents, changed plans, or decided to wait for a better market.
Before the relist rule, 1,152 listings expired or were canceled in September (418 expired, 734 canceled). 114 of them were back on the market for sale by September 30, 89 of those after a cancellation. That is the cancel-and-relist move: same house, new listing. I left those out because those sellers did not stop selling. Another 38 of the unsold properties showed up as rentals in September instead.
6. What Sellers and Buyers Should Do With This
Sellers. The homes that sold in September did not sell at their first price; most closed below it. The sellers who left unsold often never adjusted at all. If your listing expired or you canceled, the next listing has to change something the buyers already told you about: price, condition, or how the home is presented. A new sign on the same house at the same number asks the same buyers the same question. Start with a value estimate, then let me check it against what actually closed near you in the last 90 days.
Buyers. A home that came off the market unsold has an owner who already tried to sell. Some come back later, sometimes at a different price. If you saw a home earlier this year that disappeared from the search, ask me to check its history.
For listings still on the market that have cut their price, see the price-reduced pages for Orange, Seminole, Lake, and Volusia counties, and the Central Florida housing market hub for the monthly picture.
7. Frequently Asked Questions
How many Central Florida listings expired or were canceled in September 2026?
1,038 residential listings in Orange, Seminole, Lake, and Volusia counties expired or were canceled in September 2026 and were not relisted for sale by September 30: 393 expired and 645 canceled. Another 114 came off the market and were relisted within the month, so they are not counted.
What share of listings sold in September?
2,975 homes closed in September 2026 against 1,038 that left the market unsold. Of the listings that left the market either way, 74.13% sold and 25.87% did not, about 1 in 4.
What is the difference between an expired and a canceled listing?
An expired listing reached the end of its listing agreement without selling. A canceled listing ended early, before the agreement ran out, which can mean the seller changed agents, changed plans, or decided to wait. Both left the market without a sale, so this report counts both.
Is that more or less than a year ago?
In September 2025, 30.54% of listings that left the market did so unsold (1,387 unsold against 3,154 sales). In September 2026 it was 25.87%, down 4.68 percentage points.
What did the homes that sold do differently?
The homes that sold closed at a median 95.95% of their original asking price, and 75.33% sold below it. Among the listings that left unsold, 35.55% never reduced their price at all. The sold homes went under contract in a median 41 days; the unsold listings had been on the market a median 146 days when they came off.
Did your listing expire or get canceled?
I will pull your listing's full history, the price changes, the listings it competed against, and what actually sold near you, and tell you plainly what a buyer saw. No listing pitch unless you ask. Call or text Brenden at 407-616-9019.

:format(webp):quality(80)/u.realgeeks.media/homesinorlando/home_light_awards/2023_certificate.png)