Navigating the Dynamics of Today's Real Estate Market: A Comprehensive Guide
Greetings to potential homebuyers and sellers! Join us as we explore key real estate metrics to gain insights into the current market trends.
Understanding Real Estate Market Metrics
Grasping these metrics will empower you to navigate the market more effectively.
Months Supply of Inventory: Indicating Market Temperature
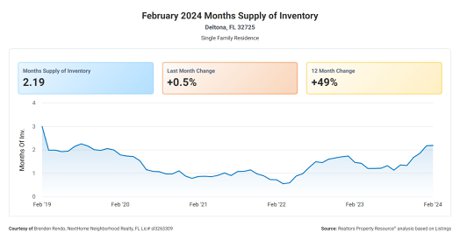
The current Months Supply of Inventory stands at 2.19, a critical indicator of market conditions. Lower numbers point to a seller's market, while higher figures suggest a buyer's advantage.
Annual Change in Inventory: More Options for Buyers
With a +48.98% increase in the 12-Month Change in Months of Inventory, the market is experiencing a significant rise in available homes, expanding options for buyers.
Median Days on Market: Quick Sales Reflect Demand
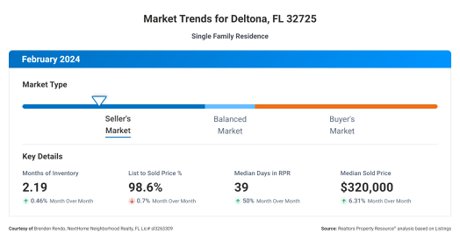
A median of 39 days on the market underscores a relatively swift sales process, potentially driven by strong demand or appealing pricing.
List to Sold Price Ratio: Competitive Pricing or Strong Demand
The List to Sold Price Percentage at 98.6% suggests homes are selling close to their listed price, indicative of competitive pricing strategies or robust buyer interest.
Median Sold Price: Establishing Market Value
The Median Sold Price, set at $320,000, offers a reference for the average sale price, aiding in the development of informed pricing strategies for both buyers and sellers.
Conclusion: A Balanced and Dynamic Market
Our analysis reveals a market characterized by a healthy balance of supply and demand, indicative of its dynamic nature. For those looking to enter the real estate market, these metrics serve as essential tools for making informed decisions, whether buying or selling. Embark on your real estate journey with confidence, equipped with the knowledge to navigate today's market landscape.