Longwood, FL Housing Market Trends Analysis For January - 32779 Zip Code Insights
Welcome, Buyers and Sellers!
Diving Into Real Estate Metrics
Today, let's dive into some fascinating real estate metrics that will provide valuable insights for both buyers and sellers in the market. Buckle up, because we have some interesting correlations to discuss!
Months Supply of Inventory Explained
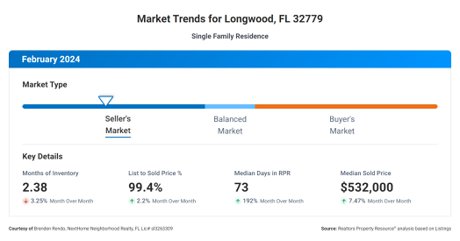
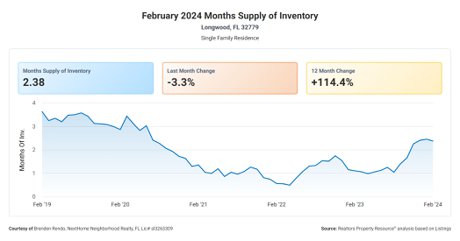
First off, let's talk about the "Months Supply of Inventory," which currently stands at 2.65. This metric refers to the number of months it would take to sell all the available homes on the market based on the current rate of sales. A lower number indicates a seller's market, where demand outweighs supply, leading to potentially higher prices and faster sales.
Year-Over-Year Inventory Change
Now, here's where it gets intriguing. The "12-Month Change in Months of Inventory" shows an impressive increase of +128.45%. This means that compared to the same period last year, there are significantly more homes available for sale. This could be an advantageous situation for buyers, as more options might mean more negotiating power and potentially lower prices.
Median Days On Market
Next up, let's look at the "Median Days Homes are On the Market," which currently stands at 25. This metric tells us how long, on average, a home stays listed before it gets sold. A lower number indicates a faster-paced market, where properties are being snatched up quickly. As a seller, this means you may have a higher chance of selling your home swiftly.
List to Sold Price Percentage Insights
But wait, there's more! The "List to Sold Price Percentage" is currently at a strong 97.3%. This percentage reflects the ratio of the final sold price to the listing price. A higher percentage suggests that homes are typically selling close to or even above their original asking prices. This is great news for sellers, as it indicates a market where buyers are willing to pay a premium for their dream home.
Understanding the Median Sold Price
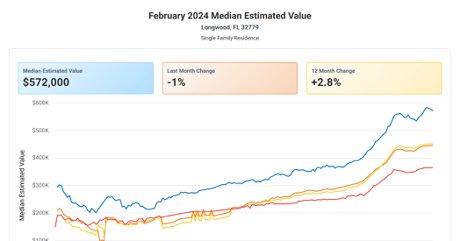
Lastly, let's talk about the "Median Sold Price," which currently stands at an impressive $495,000. This metric represents the middle point of all the sold prices in a given area. It provides an excellent reference point for both buyers and sellers to understand the market's overall price range. As a buyer, this helps you gauge what you can expect to pay, while as a seller, it gives you an idea of the potential value of your property.
Market Recap and Insights
So, let's recap! We have a relatively low "Months Supply of Inventory," signaling a seller's market. However, the "12-Month Change in Months of Inventory" shows a significant increase, potentially providing more choices for buyers. With homes spending an average of 25 days on the market, sellers can expect a swift sales process. Furthermore, the "List to Sold Price Percentage" sits at a robust 97.3%, indicating buyers' willingness to meet or exceed asking prices. Lastly, the "Median Sold Price" of $495,000 gives us a benchmark for understanding the market's price range.
Buyers and sellers, armed with this information, you now have a better understanding of the current real estate landscape. Whether you're looking to buy or sell, these metrics can guide your decisions and help you navigate the market with confidence.
Happy buying and selling!